EN TR
← BLOG

The Anomaly That Wasn't: Debugging a Graph Coloring Experiment

Graph coloring is one of those problems that looks like a puzzle and turns out to be everywhere: assigning radio frequencies so neighboring towers do not interfere, allocating CPU registers in a compiler, scheduling exams so no student sits two at once. Each is the same question underneath. Given a graph, color the vertices so no two connected vertices share a color, using as few colors as possible. It is also NP-complete, which makes it a clean place to study a tradeoff that shows up across computer science: when the exact answer is too expensive, what do you give up to get a fast one?

For a university algorithms course I implemented two approaches to it, an exact one and a heuristic one, and measured them against each other. The headline comparison went exactly as theory predicted. But one result didn’t, the heuristic appeared to violate a guarantee it is supposed to hold by proof. Revisiting the project later, I found out why. The guarantee was never broken. My experiment was quietly testing the wrong thing.

The two approaches

The exact approach is backtracking. Try to color the graph with one color, then two, then three, and so on; for each target, recursively assign colors to vertices and backtrack whenever a conflict appears. The first color count that succeeds is the true chromatic number, the real minimum. It is correct by construction and it is also exponential, since in the worst case it explores an enormous tree of color assignments.

The heuristic is an algorithm called DSatur. Instead of searching, it makes one greedy pass: repeatedly pick the uncolored vertex with the highest “saturation” (the most distinctly-colored neighbors), and give it the lowest color that still fits. It runs in polynomial time and never backtracks. It usually lands on the optimal coloring, but for general graphs it carries no guarantee of doing so. With one exception, on bipartite graphs, the two-colorable ones, DSatur is provably exact. It will always color them with two colors.

That bipartite guarantee is the thread this whole story pulls on.

The comparison that held

The first finding was the expected one, and rerunning the code now reproduces it cleanly. Brute force is correct but falls off a cliff. On random graphs it colors a 12-node graph in about ten milliseconds, then a 14-node graph in three and a half seconds, a 15-node in nineteen seconds, a 16-node in just over a minute. Each added vertex multiplies the work. By around seventeen nodes it is simply unusable.

DSatur does not have that problem. The same machine that needs a minute for sixteen nodes by brute force runs DSatur on a 140-node graph in under two milliseconds. Its runtime creeps up gently and quadratically while brute force’s explodes.

The catch is optimality, and the measured picture is nuanced. On a few hundred small random graphs, DSatur matched the exact optimum about 99% of the time, it is very good in practice, but not perfect, and on the rare miss it used an extra color.
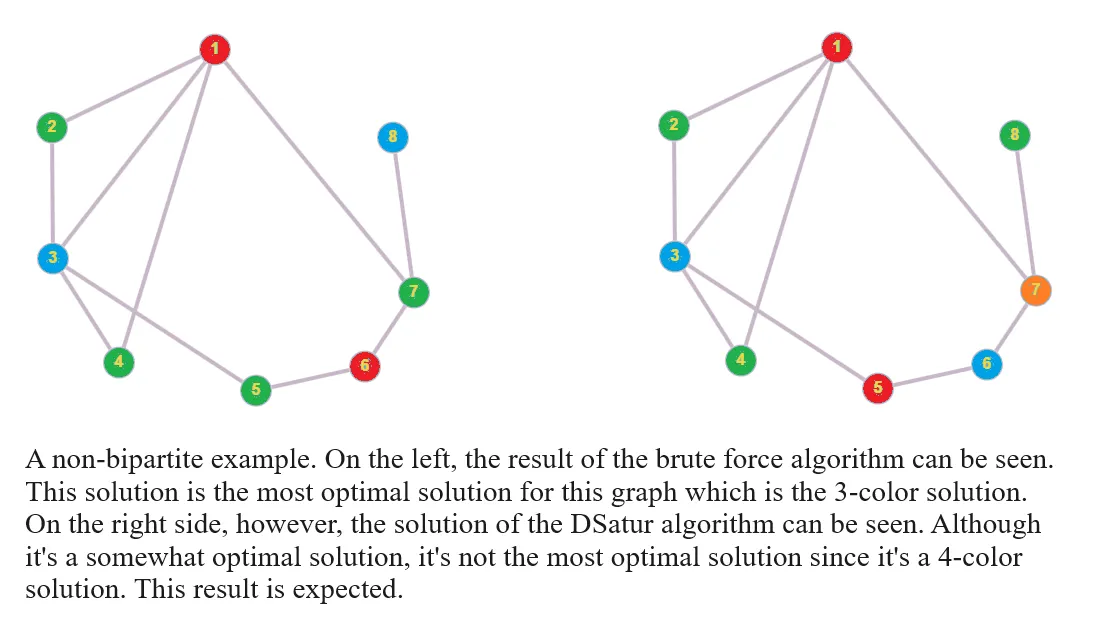
The same non-bipartite graph colored two ways: brute force using three colors on the left, DSatur using four on the right
The expected optimality gap. On this non-bipartite graph the exact method finds the 3-color optimum (left), while DSatur settles for 4 (right). This is DSatur working as designed, not a bug.

That is the tradeoff in one line: the exact method always gives the best answer and cannot scale; the heuristic almost always gives the best answer and scales effortlessly. Nothing surprising there. The surprise was elsewhere.

The anomaly

To test DSatur’s bipartite guarantee, the experiment generated random bipartite graphs and colored them, expecting two colors every time. Sometimes it got more. On paper that is alarming: a proof says DSatur colors bipartite graphs with exactly two colors, and the program was disagreeing with the proof.

At the time, the report recorded this honestly as an unexplained inconsistency between theory and measurement and moved on. That was the right instinct, to write down what actually happened rather than what was supposed to happen, but it left a loose thread. A proof does not have off days. If a textbook theorem and your experiment disagree, the experiment is almost always where the bug is. So, going back to it, I reread the test harness instead of the algorithm.

What was actually happening

The bug was in the setup, not the coloring. The harness generated a bipartite graph correctly. Then, before coloring, it built a second graph to actually run DSatur on, and built it from the wrong rule:

// G is the bipartite graph we just generated and verified.
// G1 is what actually gets colored:
for (int i = 0; i < numNodes; ++i)
    for (int j = i + 1; j < numNodes; ++j)
        if (find(G.adj[i].begin(), G.adj[i].end(), j) == G.adj[i].end())
            G1.addEdge(i, j);   // add an edge to G1 exactly when G has none

That condition adds an edge to G1 precisely when G does not have one. G1 is the complement of the bipartite graph, the graph with all the edges the original was missing. And the complement of a bipartite graph is, except in trivial cases, dense and decidedly not bipartite. So the experiment generated a clean two-colorable graph, threw it away, built its dense opposite, and asked why that didn’t come out two-colorable.

DSatur was right the whole time. It was being handed a graph that genuinely needed many colors.

Confirming it

This is the kind of claim worth checking rather than asserting, so I reran it both ways on the same generated bipartite graphs: DSatur on each graph directly, and DSatur on the complement the way the original harness did.

The result was unambiguous. Coloring the bipartite graphs directly, DSatur used exactly two colors on every single one, the guarantee holds perfectly. Coloring their complements, it used seven or eight colors every time, and those complements were bipartite zero times out of twenty. The “anomaly” reproduced exactly, and so did its explanation. There was never a conflict with the theorem; there was a one-line mistake in which graph got colored.

The actual lesson

The satisfying part of this is not the bug itself, it is small, the kind anyone writes. It is what the bug teaches about reading your own results. The most useful reflex in empirical work is to distrust a surprising measurement before you distrust settled theory. When a proof and an experiment disagree, the smart money is on the experiment, on a generator that doesn’t generate what you think, a metric that measures something adjacent to what you meant, an input that isn’t the input you intended. The original report did the honest thing by recording the contradiction plainly instead of hiding it, and that honesty is exactly what made it possible to come back and resolve it. A buried “huh, weird” is a missed bug; a written-down one is a lead.

The tradeoff under all of this is the real takeaway worth keeping. Exact algorithms give you certainty and charge exponentially for it; good heuristics give up the guarantee and run almost for free, and a strong one like DSatur is optimal far more often than the worst case suggests. Knowing where that boundary sits, where the exact method stops being affordable and the heuristic becomes the only option, is most of the engineering judgment. But none of that judgment is worth anything if the experiment measuring it is quietly coloring the wrong graph. Trust the theory, check the harness.

SONRAKİ → Where Should the Model Run? Notes on Edge vs. Cloud Inference
EN TR
← BLOG

The Anomaly That Wasn't: Debugging a Graph Coloring Experiment

Graph coloring is one of those problems that looks like a puzzle and turns out to be everywhere: assigning radio frequencies so neighboring towers do not interfere, allocating CPU registers in a compiler, scheduling exams so no student sits two at once. Each is the same question underneath. Given a graph, color the vertices so no two connected vertices share a color, using as few colors as possible. It is also NP-complete, which makes it a clean place to study a tradeoff that shows up across computer science: when the exact answer is too expensive, what do you give up to get a fast one?

For a university algorithms course I implemented two approaches to it, an exact one and a heuristic one, and measured them against each other. The headline comparison went exactly as theory predicted. But one result didn’t, the heuristic appeared to violate a guarantee it is supposed to hold by proof. Revisiting the project later, I found out why. The guarantee was never broken. My experiment was quietly testing the wrong thing.

The two approaches

The exact approach is backtracking. Try to color the graph with one color, then two, then three, and so on; for each target, recursively assign colors to vertices and backtrack whenever a conflict appears. The first color count that succeeds is the true chromatic number, the real minimum. It is correct by construction and it is also exponential, since in the worst case it explores an enormous tree of color assignments.

The heuristic is an algorithm called DSatur. Instead of searching, it makes one greedy pass: repeatedly pick the uncolored vertex with the highest “saturation” (the most distinctly-colored neighbors), and give it the lowest color that still fits. It runs in polynomial time and never backtracks. It usually lands on the optimal coloring, but for general graphs it carries no guarantee of doing so. With one exception, on bipartite graphs, the two-colorable ones, DSatur is provably exact. It will always color them with two colors.

That bipartite guarantee is the thread this whole story pulls on.

The comparison that held

The first finding was the expected one, and rerunning the code now reproduces it cleanly. Brute force is correct but falls off a cliff. On random graphs it colors a 12-node graph in about ten milliseconds, then a 14-node graph in three and a half seconds, a 15-node in nineteen seconds, a 16-node in just over a minute. Each added vertex multiplies the work. By around seventeen nodes it is simply unusable.

DSatur does not have that problem. The same machine that needs a minute for sixteen nodes by brute force runs DSatur on a 140-node graph in under two milliseconds. Its runtime creeps up gently and quadratically while brute force’s explodes.

The catch is optimality, and the measured picture is nuanced. On a few hundred small random graphs, DSatur matched the exact optimum about 99% of the time, it is very good in practice, but not perfect, and on the rare miss it used an extra color.

The same non-bipartite graph colored two ways: brute force using three colors on the left, DSatur using four on the right
The expected optimality gap. On this non-bipartite graph the exact method finds the 3-color optimum (left), while DSatur settles for 4 (right). This is DSatur working as designed, not a bug.

That is the tradeoff in one line: the exact method always gives the best answer and cannot scale; the heuristic almost always gives the best answer and scales effortlessly. Nothing surprising there. The surprise was elsewhere.

The anomaly

To test DSatur’s bipartite guarantee, the experiment generated random bipartite graphs and colored them, expecting two colors every time. Sometimes it got more. On paper that is alarming: a proof says DSatur colors bipartite graphs with exactly two colors, and the program was disagreeing with the proof.

At the time, the report recorded this honestly as an unexplained inconsistency between theory and measurement and moved on. That was the right instinct, to write down what actually happened rather than what was supposed to happen, but it left a loose thread. A proof does not have off days. If a textbook theorem and your experiment disagree, the experiment is almost always where the bug is. So, going back to it, I reread the test harness instead of the algorithm.

What was actually happening

The bug was in the setup, not the coloring. The harness generated a bipartite graph correctly. Then, before coloring, it built a second graph to actually run DSatur on, and built it from the wrong rule:

// G is the bipartite graph we just generated and verified.
// G1 is what actually gets colored:
for (int i = 0; i < numNodes; ++i)
    for (int j = i + 1; j < numNodes; ++j)
        if (find(G.adj[i].begin(), G.adj[i].end(), j) == G.adj[i].end())
            G1.addEdge(i, j);   // add an edge to G1 exactly when G has none

That condition adds an edge to G1 precisely when G does not have one. G1 is the complement of the bipartite graph, the graph with all the edges the original was missing. And the complement of a bipartite graph is, except in trivial cases, dense and decidedly not bipartite. So the experiment generated a clean two-colorable graph, threw it away, built its dense opposite, and asked why that didn’t come out two-colorable.

DSatur was right the whole time. It was being handed a graph that genuinely needed many colors.

Confirming it

This is the kind of claim worth checking rather than asserting, so I reran it both ways on the same generated bipartite graphs: DSatur on each graph directly, and DSatur on the complement the way the original harness did.

The result was unambiguous. Coloring the bipartite graphs directly, DSatur used exactly two colors on every single one, the guarantee holds perfectly. Coloring their complements, it used seven or eight colors every time, and those complements were bipartite zero times out of twenty. The “anomaly” reproduced exactly, and so did its explanation. There was never a conflict with the theorem; there was a one-line mistake in which graph got colored.

The actual lesson

The satisfying part of this is not the bug itself, it is small, the kind anyone writes. It is what the bug teaches about reading your own results. The most useful reflex in empirical work is to distrust a surprising measurement before you distrust settled theory. When a proof and an experiment disagree, the smart money is on the experiment, on a generator that doesn’t generate what you think, a metric that measures something adjacent to what you meant, an input that isn’t the input you intended. The original report did the honest thing by recording the contradiction plainly instead of hiding it, and that honesty is exactly what made it possible to come back and resolve it. A buried “huh, weird” is a missed bug; a written-down one is a lead.

The tradeoff under all of this is the real takeaway worth keeping. Exact algorithms give you certainty and charge exponentially for it; good heuristics give up the guarantee and run almost for free, and a strong one like DSatur is optimal far more often than the worst case suggests. Knowing where that boundary sits, where the exact method stops being affordable and the heuristic becomes the only option, is most of the engineering judgment. But none of that judgment is worth anything if the experiment measuring it is quietly coloring the wrong graph. Trust the theory, check the harness.

SONRAKİ → Where Should the Model Run? Notes on Edge vs. Cloud Inference
← BLOG
~/blog$ cat the-anomaly-that-wasnt.md

The Anomaly That Wasn't: Debugging a Graph Coloring Experiment

Graph coloring is one of those problems that looks like a puzzle and turns out to be everywhere: assigning radio frequencies so neighboring towers do not interfere, allocating CPU registers in a compiler, scheduling exams so no student sits two at once. Each is the same question underneath. Given a graph, color the vertices so no two connected vertices share a color, using as few colors as possible. It is also NP-complete, which makes it a clean place to study a tradeoff that shows up across computer science: when the exact answer is too expensive, what do you give up to get a fast one?

For a university algorithms course I implemented two approaches to it, an exact one and a heuristic one, and measured them against each other. The headline comparison went exactly as theory predicted. But one result didn’t, the heuristic appeared to violate a guarantee it is supposed to hold by proof. Revisiting the project later, I found out why. The guarantee was never broken. My experiment was quietly testing the wrong thing.

The two approaches

The exact approach is backtracking. Try to color the graph with one color, then two, then three, and so on; for each target, recursively assign colors to vertices and backtrack whenever a conflict appears. The first color count that succeeds is the true chromatic number, the real minimum. It is correct by construction and it is also exponential, since in the worst case it explores an enormous tree of color assignments.

The heuristic is an algorithm called DSatur. Instead of searching, it makes one greedy pass: repeatedly pick the uncolored vertex with the highest “saturation” (the most distinctly-colored neighbors), and give it the lowest color that still fits. It runs in polynomial time and never backtracks. It usually lands on the optimal coloring, but for general graphs it carries no guarantee of doing so. With one exception, on bipartite graphs, the two-colorable ones, DSatur is provably exact. It will always color them with two colors.

That bipartite guarantee is the thread this whole story pulls on.

The comparison that held

The first finding was the expected one, and rerunning the code now reproduces it cleanly. Brute force is correct but falls off a cliff. On random graphs it colors a 12-node graph in about ten milliseconds, then a 14-node graph in three and a half seconds, a 15-node in nineteen seconds, a 16-node in just over a minute. Each added vertex multiplies the work. By around seventeen nodes it is simply unusable.

DSatur does not have that problem. The same machine that needs a minute for sixteen nodes by brute force runs DSatur on a 140-node graph in under two milliseconds. Its runtime creeps up gently and quadratically while brute force’s explodes.

The catch is optimality, and the measured picture is nuanced. On a few hundred small random graphs, DSatur matched the exact optimum about 99% of the time, it is very good in practice, but not perfect, and on the rare miss it used an extra color.

The same non-bipartite graph colored two ways: brute force using three colors on the left, DSatur using four on the right
The expected optimality gap. On this non-bipartite graph the exact method finds the 3-color optimum (left), while DSatur settles for 4 (right). This is DSatur working as designed, not a bug.

That is the tradeoff in one line: the exact method always gives the best answer and cannot scale; the heuristic almost always gives the best answer and scales effortlessly. Nothing surprising there. The surprise was elsewhere.

The anomaly

To test DSatur’s bipartite guarantee, the experiment generated random bipartite graphs and colored them, expecting two colors every time. Sometimes it got more. On paper that is alarming: a proof says DSatur colors bipartite graphs with exactly two colors, and the program was disagreeing with the proof.

At the time, the report recorded this honestly as an unexplained inconsistency between theory and measurement and moved on. That was the right instinct, to write down what actually happened rather than what was supposed to happen, but it left a loose thread. A proof does not have off days. If a textbook theorem and your experiment disagree, the experiment is almost always where the bug is. So, going back to it, I reread the test harness instead of the algorithm.

What was actually happening

The bug was in the setup, not the coloring. The harness generated a bipartite graph correctly. Then, before coloring, it built a second graph to actually run DSatur on, and built it from the wrong rule:

// G is the bipartite graph we just generated and verified.
// G1 is what actually gets colored:
for (int i = 0; i < numNodes; ++i)
    for (int j = i + 1; j < numNodes; ++j)
        if (find(G.adj[i].begin(), G.adj[i].end(), j) == G.adj[i].end())
            G1.addEdge(i, j);   // add an edge to G1 exactly when G has none

That condition adds an edge to G1 precisely when G does not have one. G1 is the complement of the bipartite graph, the graph with all the edges the original was missing. And the complement of a bipartite graph is, except in trivial cases, dense and decidedly not bipartite. So the experiment generated a clean two-colorable graph, threw it away, built its dense opposite, and asked why that didn’t come out two-colorable.

DSatur was right the whole time. It was being handed a graph that genuinely needed many colors.

Confirming it

This is the kind of claim worth checking rather than asserting, so I reran it both ways on the same generated bipartite graphs: DSatur on each graph directly, and DSatur on the complement the way the original harness did.

The result was unambiguous. Coloring the bipartite graphs directly, DSatur used exactly two colors on every single one, the guarantee holds perfectly. Coloring their complements, it used seven or eight colors every time, and those complements were bipartite zero times out of twenty. The “anomaly” reproduced exactly, and so did its explanation. There was never a conflict with the theorem; there was a one-line mistake in which graph got colored.

The actual lesson

The satisfying part of this is not the bug itself, it is small, the kind anyone writes. It is what the bug teaches about reading your own results. The most useful reflex in empirical work is to distrust a surprising measurement before you distrust settled theory. When a proof and an experiment disagree, the smart money is on the experiment, on a generator that doesn’t generate what you think, a metric that measures something adjacent to what you meant, an input that isn’t the input you intended. The original report did the honest thing by recording the contradiction plainly instead of hiding it, and that honesty is exactly what made it possible to come back and resolve it. A buried “huh, weird” is a missed bug; a written-down one is a lead.

The tradeoff under all of this is the real takeaway worth keeping. Exact algorithms give you certainty and charge exponentially for it; good heuristics give up the guarantee and run almost for free, and a strong one like DSatur is optimal far more often than the worst case suggests. Knowing where that boundary sits, where the exact method stops being affordable and the heuristic becomes the only option, is most of the engineering judgment. But none of that judgment is worth anything if the experiment measuring it is quietly coloring the wrong graph. Trust the theory, check the harness.

SONRAKİ → Where Should the Model Run? Notes on Edge vs. Cloud Inference