EN TR
← PROJELER
HARDWARE
Sep 2024 – Jun 2025

Mobile 12-Lead ECG Platform

A solo, full-stack real-time electrocardiography system. A custom STM32 and ADS1292R analog front end streams cardiac signals over USB to a Flutter application that renders twelve leads on a calibrated medical grid at 60 fps, fully offline.

STM32F103ADS1292RC / C++ firmwareTinyUSBFlutterDartUSB serial

A handheld electrocardiography platform that captures real cardiac signals through a custom analog front end and renders up to twelve leads on a calibrated medical grid, in real time, entirely on a consumer phone with no network connection. The system spans the whole stack: an instrumentation-grade analog acquisition board, firmware on an STM32 microcontroller, a USB transport layer, and a Flutter application that performs signal conditioning and high-frequency custom rendering. It was built solo over nine months as a graduation project at Sabancı University.
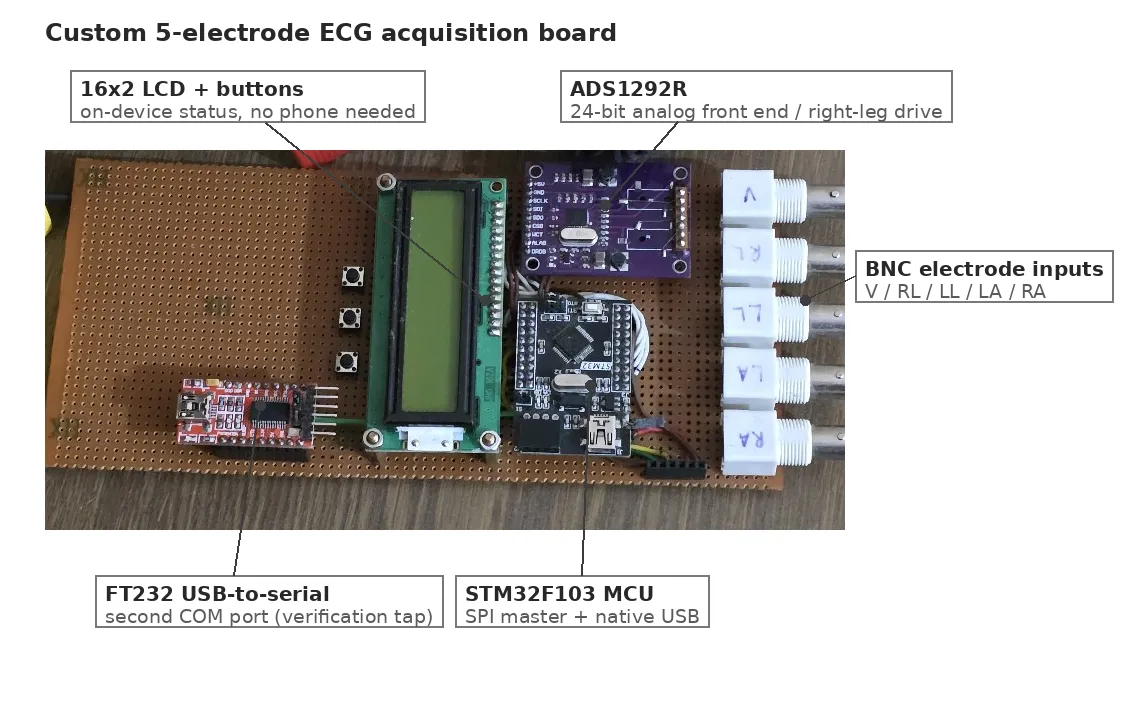
The ECG acquisition board with annotated callouts for the STM32, ADS1292R, FT232, LCD, and BNC inputs
The custom acquisition board. STM32F103 drives the ADS1292R analog front end over SPI; the FT232 bridge exposes a second USB port for verification; BNC connectors carry the electrode inputs.
  • Up to 500 samples per second per channel, streamed over USB
  • Twelve lead lanes drawn at a steady 60 fps
  • Under 40 ms from acquisition to on-screen pixel
  • Under 100 USD bill of materials for the acquisition hardware
  • Runs fully offline, with no cloud, no account, and no network dependency

The problem

A twelve-lead electrocardiogram is the clinical reference for cardiac assessment because each lead observes the heart’s electrical activity from a different angle. That spatial coverage is what allows ischemia to be localized and what distinguishes one arrhythmia or conduction abnormality from another. A single lead is sufficient to screen a heart rhythm, but it cannot carry that spatial information.

The accessible end of the market reflects this gap. Consumer wearables and low-cost devices almost always expose one or two leads, while genuine multi-lead capability stays inside bulky and expensive clinical equipment. Many software-based solutions also transmit raw signal to a remote server for rendering or analysis. That round trip introduces latency and creates a privacy surface for data that is inherently sensitive.

This project targets the space in between: a way to view many leads at once, in real time, on a device a person already carries, with the signal never leaving the phone, at a hardware cost suited to community screening and education. The goal is accessible visualization and a reproducible performance baseline for mobile multi-lead display, not a regulatory-cleared diagnostic instrument. Framing the scope this way keeps the contribution precise. The platform demonstrates that the full acquisition and rendering pipeline can run on commodity hardware at clinical frame rates, which is the foundation that any later diagnostic capability would be built on.

System overview

The pipeline has four stages, each owned end to end:

  1. Acquisition. A custom analog board digitizes biopotentials from chest and limb electrodes.
  2. Transport. The microcontroller frames samples and streams them over native USB.
  3. Conditioning. The application filters and buffers the incoming stream in real time.
  4. Rendering. A custom paint loop draws the calibrated grid and waveforms at 60 fps.
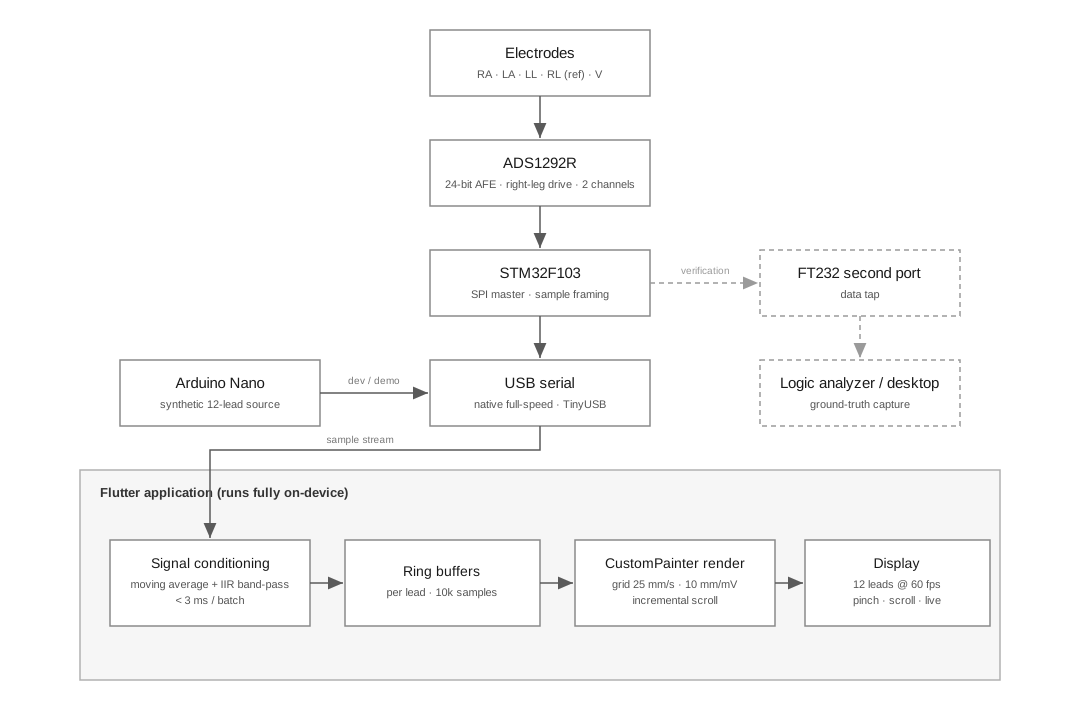
Signal chain diagram showing acquisition, transport, conditioning, and rendering stages, plus the synthetic source and verification branch
The full signal chain: from electrode through the analog front end, USB transport, and Flutter conditioning pipeline to the rendered twelve-lead display. The synthetic source and dual-port verification branch are shown separately.

Hardware: the analog front end

The acquisition board is the component that separates this project from a charting application. At its center is the ADS1292R, a 24-bit, two-channel, simultaneous-sampling biopotential analog front end with an integrated right-leg drive amplifier and lead-off detection. Reading a clean electrocardiogram is difficult because the signal of interest sits at the level of microvolts and is buried under mains interference and motion artifact that can be orders of magnitude larger.

The right-leg drive is what makes the recovered trace clean. It continuously senses the common-mode voltage present on the body, inverts it, and feeds it back through the reference electrode, actively cancelling the interference that both inputs share. The result is a high common-mode rejection ratio and a stable baseline, which is visible directly in the recorded P, QRS, and T morphology.

The board exposes five electrode inputs through standard BNC connectors: right arm, left arm, left leg, the driven right-leg reference, and one precordial chest position. Standard clip electrodes connect to a volunteer. Because the front end provides two simultaneous acquisition channels, the recorded data covers the limb-derived leads, while the full twelve-lane view is completed from a separate synthetic source described below. Every connection is hand-soldered on perfboard, which makes the recovery of a clean microvolt-level signal a result in its own right.

Skin preparation has as much influence on the trace as the front end does. Contact points are wiped with isopropyl alcohol to remove skin oils and lower contact impedance, and a saline solution wets the electrode contacts so the signal couples cleanly through the reusable clip leads.
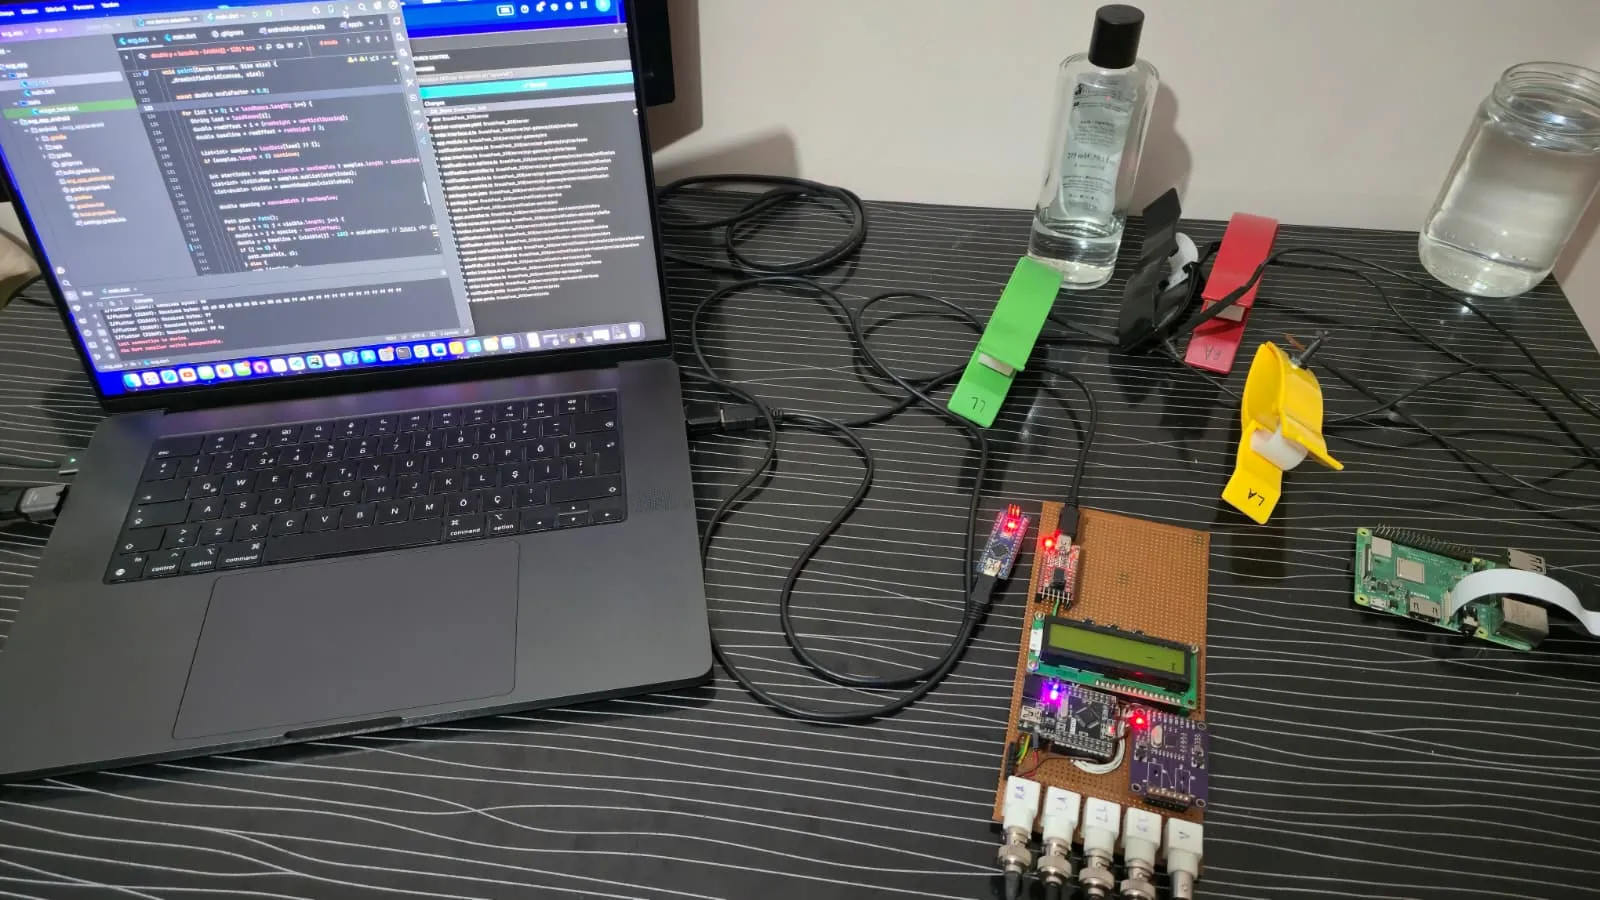
The live system during a development session: application source on the laptop, the board powered with its display active, limb clips and the alcohol and saline prep staged
The bench setup during a development session. The acquisition board is powered and connected to the laptop over USB; limb clips, isopropyl alcohol, and saline are staged for a live capture.
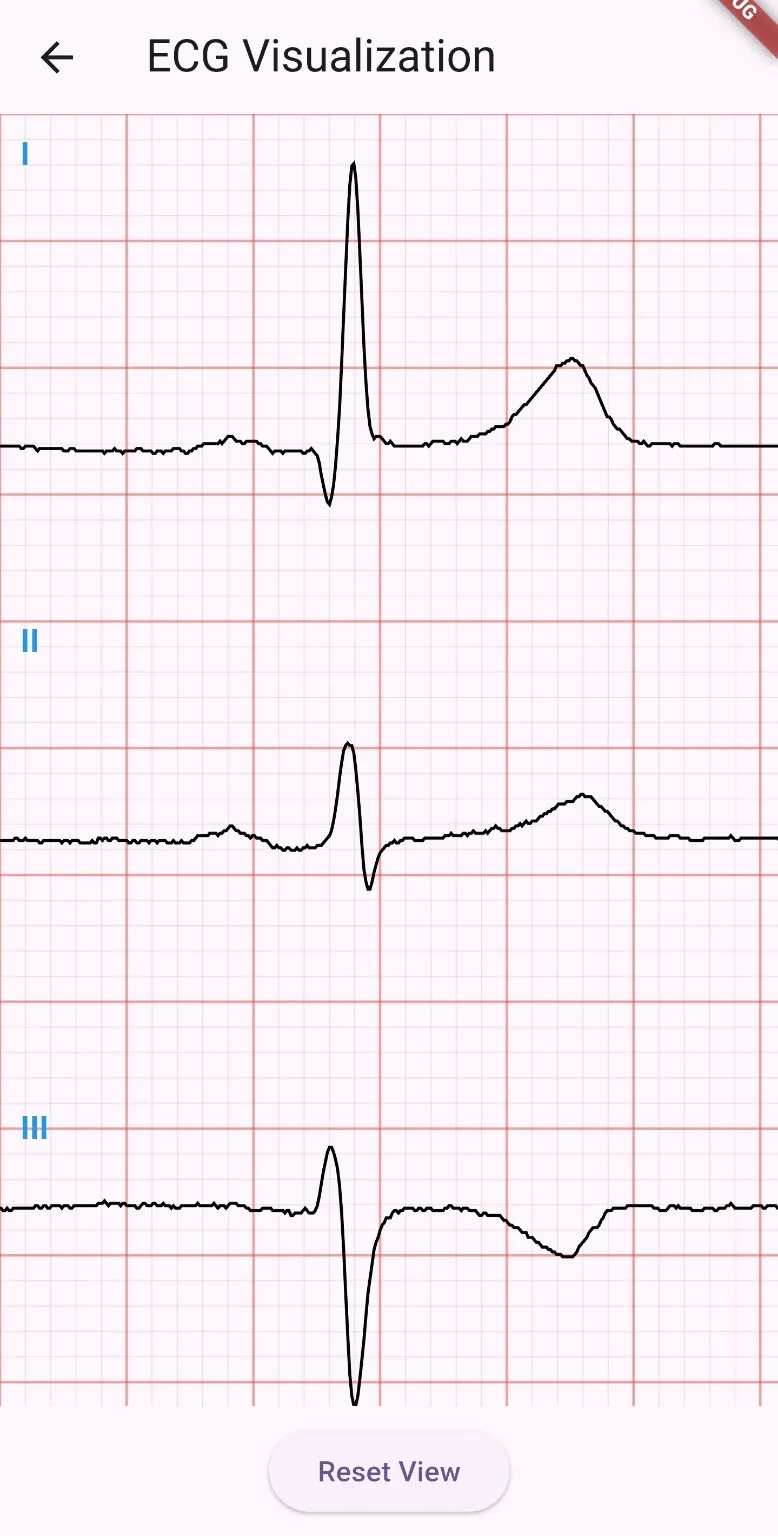
Live ECG capture showing leads I, II, and III on the calibrated grid
Live capture from a volunteer through the custom front end. Leads I, II, and III rendered on the calibrated medical grid at 25 mm/s and 10 mm/mV.

Firmware: STM32 acquisition

An STM32F103 drives the front end. The firmware acts as an SPI master to the ADS1292R, configures its registers for the target sample rate and gain, and reads conversion frames as they become available on the data-ready interrupt. Each frame is packed into a fixed-size record and pushed out over the microcontroller’s native full-speed USB interface using the TinyUSB stack.

Choosing the F103 specifically mattered here. Its on-chip USB peripheral allows the device to enumerate as a USB serial endpoint without an external bridge, which keeps the data path on the phone side short and the timing predictable. The firmware sets the ADS1292R into continuous mode at 500 samples per second, packs each conversion into a fixed-size record, and streams it without dropping frames across extended runs.

A self-instrumented verification path

The board carries a second, independent USB-to-serial bridge (an FT232) alongside the STM32’s native USB. This exposes two ports at once: the phone listens on the native USB endpoint while a desktop analyzer or logic analyzer reads the same stream on the second port. This dual output was used during timing tests, and for the long-duration run a logic analyzer captured the USB frames directly off the wire. Designing observability into the instrument itself, rather than trusting the phone’s view of the data, is a deliberate engineering choice and one of the more useful decisions in the project.
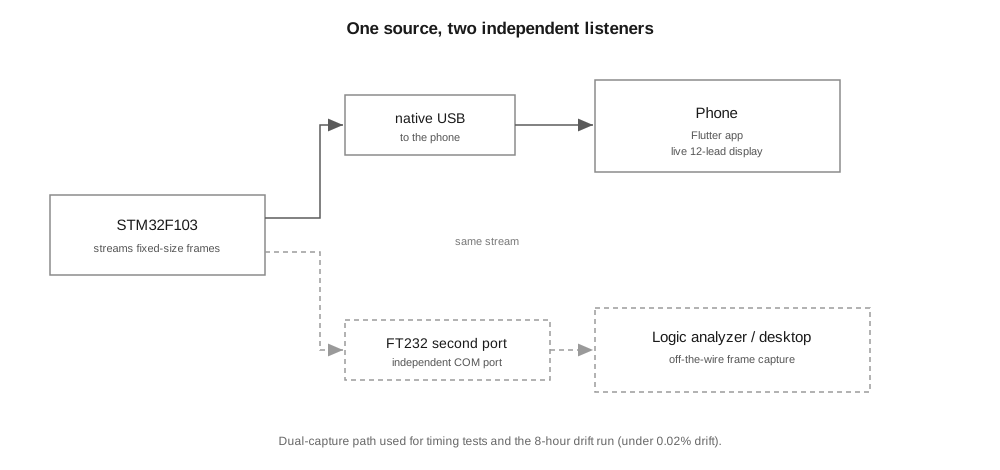
Diagram of the dual-capture verification path: the board emitting to both the phone's USB endpoint and the FT232 serial bridge simultaneously
The dual-capture verification path. Both the native STM32 USB port and the FT232 bridge are active simultaneously, letting a desktop analyzer read the same stream the phone receives.

Two signal sources by design

Development used two distinct signal sources rather than one. A standalone Arduino Nano runs a synthetic generator that replays prerecorded twelve-lead arrays over serial at a fixed rate. This produces a deterministic, repeatable input that isolates the application and rendering pipeline from the variability of live acquisition, which is what makes it possible to profile rendering performance honestly and to demonstrate all twelve lanes at once.
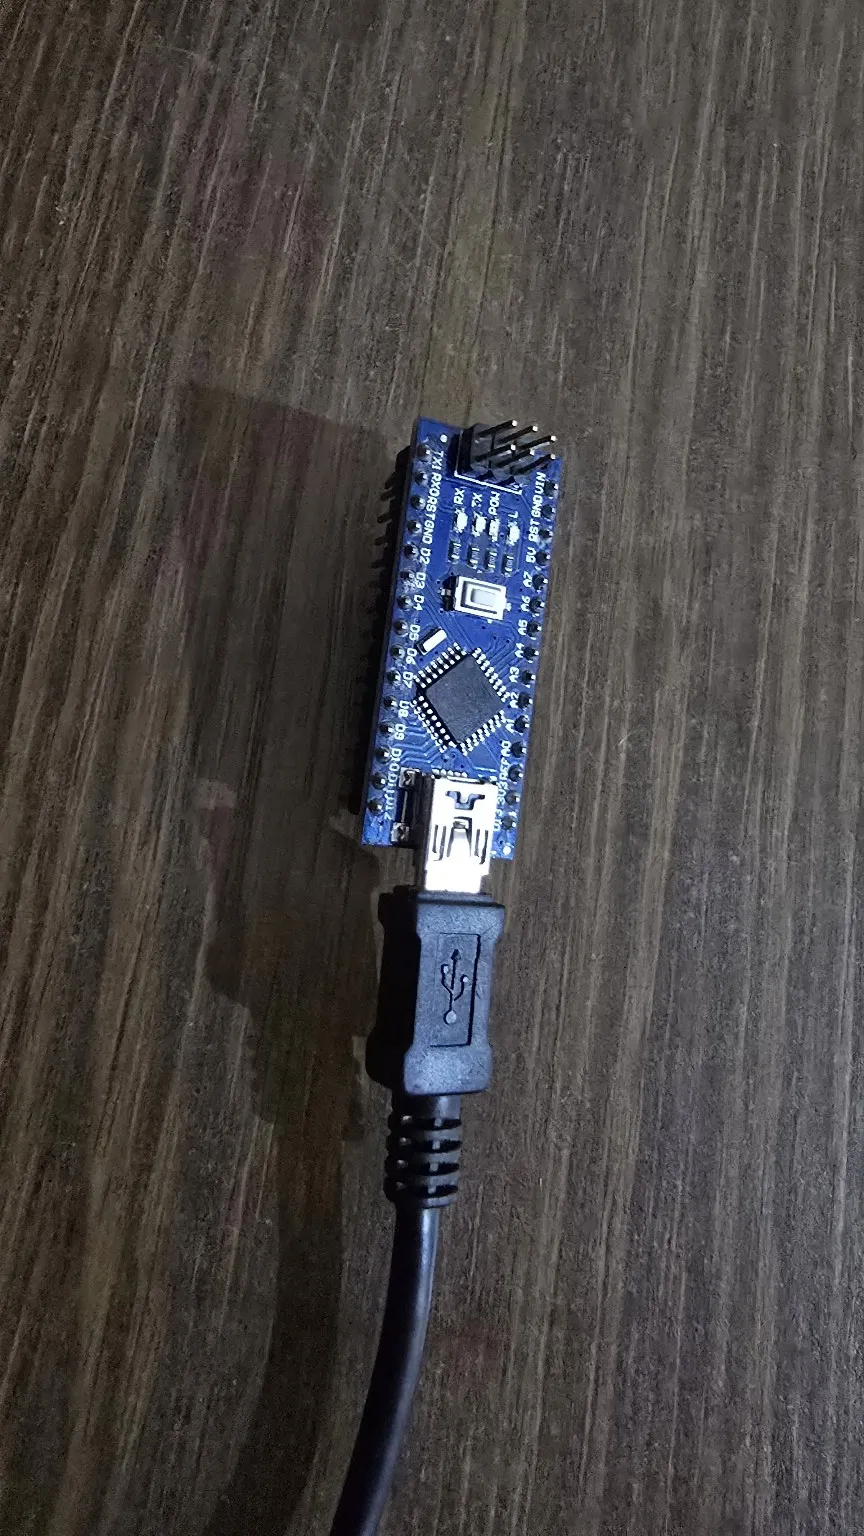
The standalone Arduino Nano synthetic ECG generator board
The standalone synthetic generator. An Arduino Nano replays prerecorded twelve-lead arrays over serial at a fixed rate, producing a deterministic input for isolating and profiling the rendering pipeline.
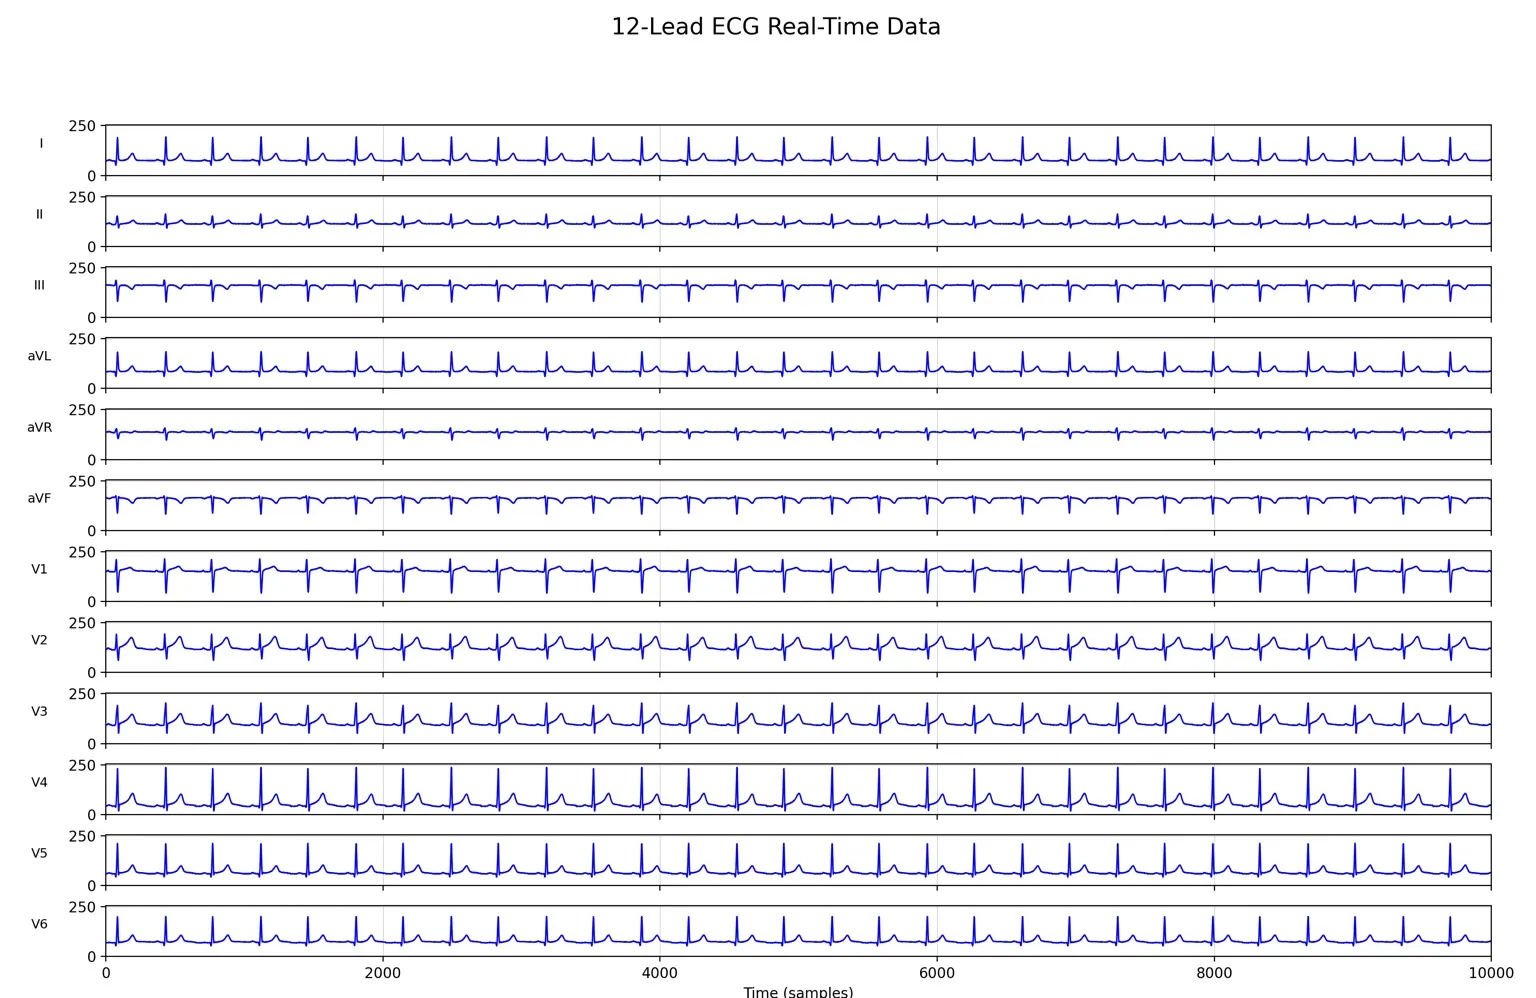
All twelve ECG lead lanes rendered simultaneously on the calibrated grid from the synthetic source
The full twelve-lead view rendered from the synthetic source. All lanes are shown simultaneously on the calibrated grid, confirming the rendering pipeline before connecting real electrodes.

The STM32 front end provides the second source: real biopotentials from a person. Separating a controlled test harness from the live instrument is the kind of discipline that keeps a result trustworthy, because each part of the system can be exercised independently.

Transport: from Wi-Fi to USB

The original design streamed samples wirelessly. In practice the wireless link proved unreliable under sustained load, with intermittent drops that corrupted a real-time trace in ways that were hard to recover from. The transport was rebuilt around a wired USB serial connection. This single decision moved link reliability from roughly four in five sessions to near certainty, removed an entire class of synchronization failures, and simplified the timing model on both ends. Trading a more impressive-sounding wireless feature for a connection that simply works was the correct call, and it shaped the rest of the system’s reliability budget.
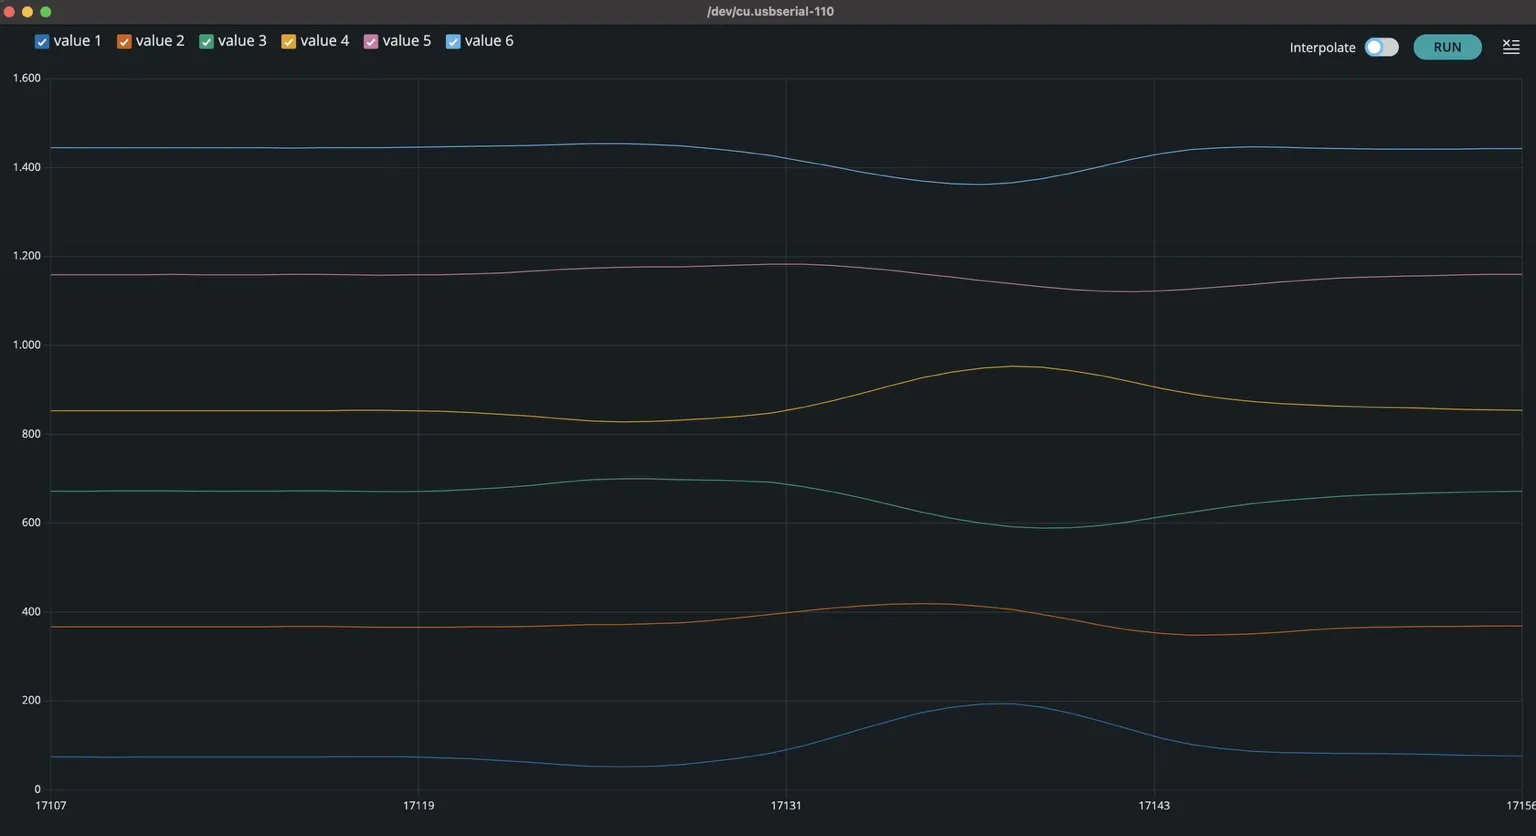
Raw USB serial stream from the acquisition board plotted on a desktop analyzer, showing the low-level signal during bring-up and debugging
The raw serial stream on a desktop plotter during firmware bring-up. This low-level view was used to verify frame timing and data integrity before the Flutter application was connected.

Signal conditioning

Incoming samples are conditioned on the phone before they reach the screen. A moving-average stage smooths sample-to-sample noise, and an IIR band-pass filter removes baseline wander at the low end and high-frequency noise at the top, leaving the diagnostic morphology intact. The filter chain is implemented directly in Dart and runs in under three milliseconds per batch, which keeps it well within the per-frame budget and avoids any native dependency. Running the full conditioning path inside the application also means the signal is never handed to an external service to be cleaned.

Rendering: a calibrated grid at 60 fps

The display is drawn with a custom paint loop rather than a charting library, which is what makes both the calibration and the frame rate achievable. The grid follows standard electrocardiogram paper: a 25 mm per second sweep and a 10 mm per millivolt gain, with millimeters mapped to device pixels using the screen’s physical density so the grid is correctly scaled on real hardware.

The central performance technique is in how the scrolling trace is drawn. Redrawing every lane’s full history on each frame would mean repainting tens of thousands of points sixty times a second. Instead, the existing canvas content is translated by the per-frame sample advance, the newly exposed strip is clipped, and only the new segment of waveform is drawn into it. This turns a full redraw into an incremental one and roughly halves the per-frame cost, which is what holds the frame rate steady across all twelve lanes.

Each lead is backed by a ring buffer capped at ten thousand samples, and samples arrive in batches of around fifty per frame, which bounds memory and smooths the update cadence. A pinch gesture zooms the time axis, a swipe scrolls back through history, and a control returns the view to the live tail. The same Flutter and Skia codebase renders identically across platforms.
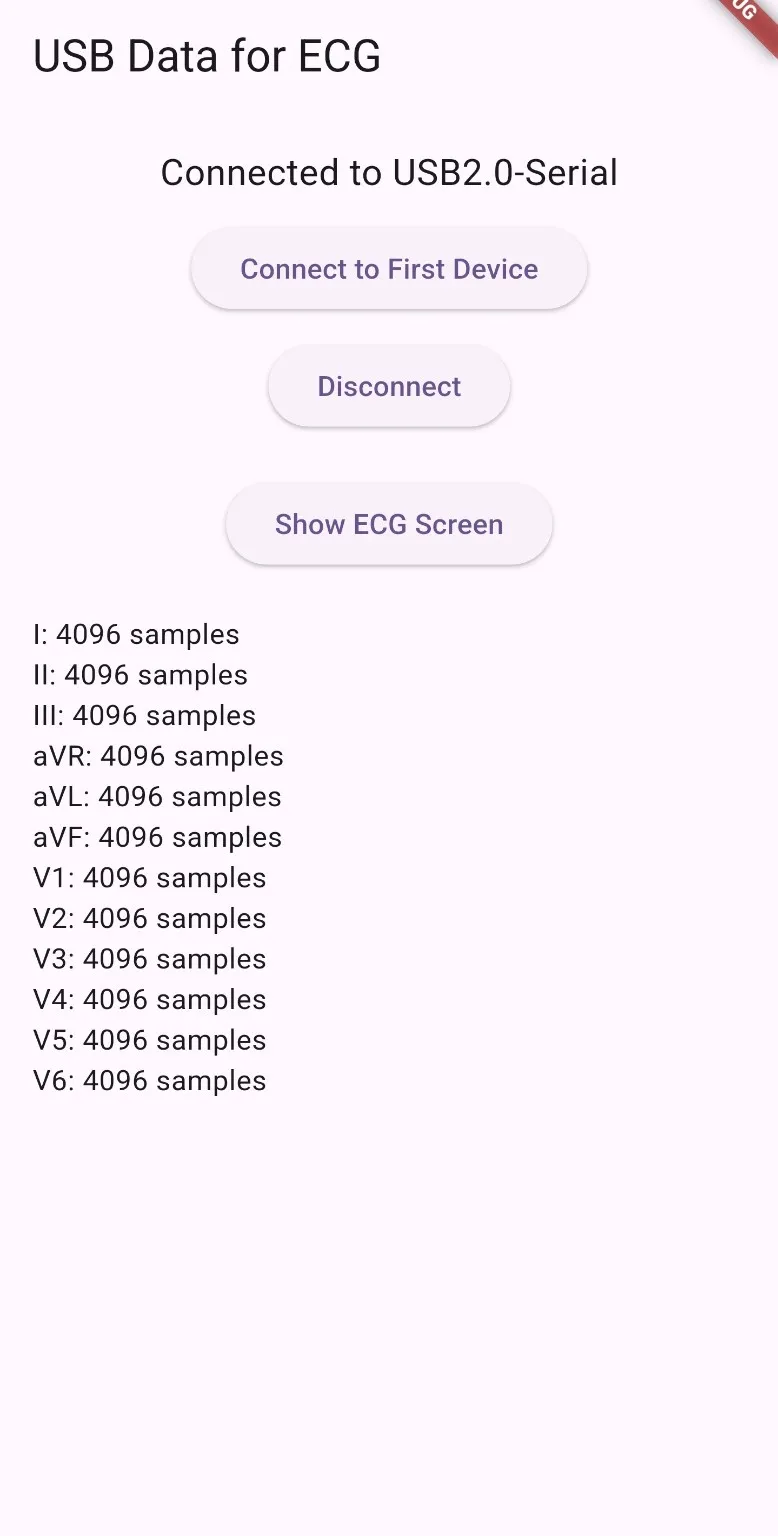
The Flutter application showing the device connection screen and the live ECG visualization with twelve lead lanes
The Flutter application. Left: device connection and live sample counters. Right: the twelve-lead visualization screen with the calibrated grid and scrolling waveforms.

Validation and performance

The system was exercised both with the synthetic generator and with live acquisition. Through the custom front end, a volunteer produced clean P, QRS, and T complexes on the limb-derived leads under mild motion, confirming that the analog chain and the right-leg drive perform as intended on a real signal.

On the performance side, end-to-end latency from acquisition to displayed pixel stayed under 40 ms during the volunteer test, with clean P, QRS, and T morphology on every active channel. The signal-conditioning chain ran in under 3 ms per batch on a Snapdragon 845, measured from the timing log, and rendering held a steady 60 fps with no jank reported by Android’s profiler.

Durability was checked with an overnight run. The board streamed continuously for eight hours while a logic analyzer captured the USB frames off the wire. Over that window the sample counter missed 32 ticks, a drift of under 0.02 percent, and the display held 60 fps throughout. That run is the evidence that the pipeline can sustain a real clinical session rather than only a short demo.

Scope and next steps

The grid currently uses a fixed compile-time scaling rather than adapting to signal amplitude, evaluation leaned more on synthetic than live data, and power draw over long sessions was not yet profiled. Each of these is a clear next step rather than an open question: adaptive grid scaling, a broader live dataset, and a power characterization pass. The longer-term direction is on-device rhythm analysis, where the existing low-latency pipeline already provides the data path that such a model would consume.

EN TR
← PROJELER
HARDWARE
Sep 2024 – Jun 2025

Mobile 12-Lead ECG Platform

A solo, full-stack real-time electrocardiography system. A custom STM32 and ADS1292R analog front end streams cardiac signals over USB to a Flutter application that renders twelve leads on a calibrated medical grid at 60 fps, fully offline.

STM32F103ADS1292RC / C++ firmwareTinyUSBFlutterDartUSB serial

A handheld electrocardiography platform that captures real cardiac signals through a custom analog front end and renders up to twelve leads on a calibrated medical grid, in real time, entirely on a consumer phone with no network connection. The system spans the whole stack: an instrumentation-grade analog acquisition board, firmware on an STM32 microcontroller, a USB transport layer, and a Flutter application that performs signal conditioning and high-frequency custom rendering. It was built solo over nine months as a graduation project at Sabancı University.

The ECG acquisition board with annotated callouts for the STM32, ADS1292R, FT232, LCD, and BNC inputs
The custom acquisition board. STM32F103 drives the ADS1292R analog front end over SPI; the FT232 bridge exposes a second USB port for verification; BNC connectors carry the electrode inputs.
  • Up to 500 samples per second per channel, streamed over USB
  • Twelve lead lanes drawn at a steady 60 fps
  • Under 40 ms from acquisition to on-screen pixel
  • Under 100 USD bill of materials for the acquisition hardware
  • Runs fully offline, with no cloud, no account, and no network dependency

The problem

A twelve-lead electrocardiogram is the clinical reference for cardiac assessment because each lead observes the heart’s electrical activity from a different angle. That spatial coverage is what allows ischemia to be localized and what distinguishes one arrhythmia or conduction abnormality from another. A single lead is sufficient to screen a heart rhythm, but it cannot carry that spatial information.

The accessible end of the market reflects this gap. Consumer wearables and low-cost devices almost always expose one or two leads, while genuine multi-lead capability stays inside bulky and expensive clinical equipment. Many software-based solutions also transmit raw signal to a remote server for rendering or analysis. That round trip introduces latency and creates a privacy surface for data that is inherently sensitive.

This project targets the space in between: a way to view many leads at once, in real time, on a device a person already carries, with the signal never leaving the phone, at a hardware cost suited to community screening and education. The goal is accessible visualization and a reproducible performance baseline for mobile multi-lead display, not a regulatory-cleared diagnostic instrument. Framing the scope this way keeps the contribution precise. The platform demonstrates that the full acquisition and rendering pipeline can run on commodity hardware at clinical frame rates, which is the foundation that any later diagnostic capability would be built on.

System overview

The pipeline has four stages, each owned end to end:

  1. Acquisition. A custom analog board digitizes biopotentials from chest and limb electrodes.
  2. Transport. The microcontroller frames samples and streams them over native USB.
  3. Conditioning. The application filters and buffers the incoming stream in real time.
  4. Rendering. A custom paint loop draws the calibrated grid and waveforms at 60 fps.
Signal chain diagram showing acquisition, transport, conditioning, and rendering stages, plus the synthetic source and verification branch
The full signal chain: from electrode through the analog front end, USB transport, and Flutter conditioning pipeline to the rendered twelve-lead display. The synthetic source and dual-port verification branch are shown separately.

Hardware: the analog front end

The acquisition board is the component that separates this project from a charting application. At its center is the ADS1292R, a 24-bit, two-channel, simultaneous-sampling biopotential analog front end with an integrated right-leg drive amplifier and lead-off detection. Reading a clean electrocardiogram is difficult because the signal of interest sits at the level of microvolts and is buried under mains interference and motion artifact that can be orders of magnitude larger.

The right-leg drive is what makes the recovered trace clean. It continuously senses the common-mode voltage present on the body, inverts it, and feeds it back through the reference electrode, actively cancelling the interference that both inputs share. The result is a high common-mode rejection ratio and a stable baseline, which is visible directly in the recorded P, QRS, and T morphology.

The board exposes five electrode inputs through standard BNC connectors: right arm, left arm, left leg, the driven right-leg reference, and one precordial chest position. Standard clip electrodes connect to a volunteer. Because the front end provides two simultaneous acquisition channels, the recorded data covers the limb-derived leads, while the full twelve-lane view is completed from a separate synthetic source described below. Every connection is hand-soldered on perfboard, which makes the recovery of a clean microvolt-level signal a result in its own right.

Skin preparation has as much influence on the trace as the front end does. Contact points are wiped with isopropyl alcohol to remove skin oils and lower contact impedance, and a saline solution wets the electrode contacts so the signal couples cleanly through the reusable clip leads.

The live system during a development session: application source on the laptop, the board powered with its display active, limb clips and the alcohol and saline prep staged
The bench setup during a development session. The acquisition board is powered and connected to the laptop over USB; limb clips, isopropyl alcohol, and saline are staged for a live capture.
Live ECG capture showing leads I, II, and III on the calibrated grid
Live capture from a volunteer through the custom front end. Leads I, II, and III rendered on the calibrated medical grid at 25 mm/s and 10 mm/mV.

Firmware: STM32 acquisition

An STM32F103 drives the front end. The firmware acts as an SPI master to the ADS1292R, configures its registers for the target sample rate and gain, and reads conversion frames as they become available on the data-ready interrupt. Each frame is packed into a fixed-size record and pushed out over the microcontroller’s native full-speed USB interface using the TinyUSB stack.

Choosing the F103 specifically mattered here. Its on-chip USB peripheral allows the device to enumerate as a USB serial endpoint without an external bridge, which keeps the data path on the phone side short and the timing predictable. The firmware sets the ADS1292R into continuous mode at 500 samples per second, packs each conversion into a fixed-size record, and streams it without dropping frames across extended runs.

A self-instrumented verification path

The board carries a second, independent USB-to-serial bridge (an FT232) alongside the STM32’s native USB. This exposes two ports at once: the phone listens on the native USB endpoint while a desktop analyzer or logic analyzer reads the same stream on the second port. This dual output was used during timing tests, and for the long-duration run a logic analyzer captured the USB frames directly off the wire. Designing observability into the instrument itself, rather than trusting the phone’s view of the data, is a deliberate engineering choice and one of the more useful decisions in the project.

Diagram of the dual-capture verification path: the board emitting to both the phone's USB endpoint and the FT232 serial bridge simultaneously
The dual-capture verification path. Both the native STM32 USB port and the FT232 bridge are active simultaneously, letting a desktop analyzer read the same stream the phone receives.

Two signal sources by design

Development used two distinct signal sources rather than one. A standalone Arduino Nano runs a synthetic generator that replays prerecorded twelve-lead arrays over serial at a fixed rate. This produces a deterministic, repeatable input that isolates the application and rendering pipeline from the variability of live acquisition, which is what makes it possible to profile rendering performance honestly and to demonstrate all twelve lanes at once.

The standalone Arduino Nano synthetic ECG generator board
The standalone synthetic generator. An Arduino Nano replays prerecorded twelve-lead arrays over serial at a fixed rate, producing a deterministic input for isolating and profiling the rendering pipeline.
All twelve ECG lead lanes rendered simultaneously on the calibrated grid from the synthetic source
The full twelve-lead view rendered from the synthetic source. All lanes are shown simultaneously on the calibrated grid, confirming the rendering pipeline before connecting real electrodes.

The STM32 front end provides the second source: real biopotentials from a person. Separating a controlled test harness from the live instrument is the kind of discipline that keeps a result trustworthy, because each part of the system can be exercised independently.

Transport: from Wi-Fi to USB

The original design streamed samples wirelessly. In practice the wireless link proved unreliable under sustained load, with intermittent drops that corrupted a real-time trace in ways that were hard to recover from. The transport was rebuilt around a wired USB serial connection. This single decision moved link reliability from roughly four in five sessions to near certainty, removed an entire class of synchronization failures, and simplified the timing model on both ends. Trading a more impressive-sounding wireless feature for a connection that simply works was the correct call, and it shaped the rest of the system’s reliability budget.

Raw USB serial stream from the acquisition board plotted on a desktop analyzer, showing the low-level signal during bring-up and debugging
The raw serial stream on a desktop plotter during firmware bring-up. This low-level view was used to verify frame timing and data integrity before the Flutter application was connected.

Signal conditioning

Incoming samples are conditioned on the phone before they reach the screen. A moving-average stage smooths sample-to-sample noise, and an IIR band-pass filter removes baseline wander at the low end and high-frequency noise at the top, leaving the diagnostic morphology intact. The filter chain is implemented directly in Dart and runs in under three milliseconds per batch, which keeps it well within the per-frame budget and avoids any native dependency. Running the full conditioning path inside the application also means the signal is never handed to an external service to be cleaned.

Rendering: a calibrated grid at 60 fps

The display is drawn with a custom paint loop rather than a charting library, which is what makes both the calibration and the frame rate achievable. The grid follows standard electrocardiogram paper: a 25 mm per second sweep and a 10 mm per millivolt gain, with millimeters mapped to device pixels using the screen’s physical density so the grid is correctly scaled on real hardware.

The central performance technique is in how the scrolling trace is drawn. Redrawing every lane’s full history on each frame would mean repainting tens of thousands of points sixty times a second. Instead, the existing canvas content is translated by the per-frame sample advance, the newly exposed strip is clipped, and only the new segment of waveform is drawn into it. This turns a full redraw into an incremental one and roughly halves the per-frame cost, which is what holds the frame rate steady across all twelve lanes.

Each lead is backed by a ring buffer capped at ten thousand samples, and samples arrive in batches of around fifty per frame, which bounds memory and smooths the update cadence. A pinch gesture zooms the time axis, a swipe scrolls back through history, and a control returns the view to the live tail. The same Flutter and Skia codebase renders identically across platforms.

The Flutter application showing the device connection screen and the live ECG visualization with twelve lead lanes
The Flutter application. Left: device connection and live sample counters. Right: the twelve-lead visualization screen with the calibrated grid and scrolling waveforms.

Validation and performance

The system was exercised both with the synthetic generator and with live acquisition. Through the custom front end, a volunteer produced clean P, QRS, and T complexes on the limb-derived leads under mild motion, confirming that the analog chain and the right-leg drive perform as intended on a real signal.

On the performance side, end-to-end latency from acquisition to displayed pixel stayed under 40 ms during the volunteer test, with clean P, QRS, and T morphology on every active channel. The signal-conditioning chain ran in under 3 ms per batch on a Snapdragon 845, measured from the timing log, and rendering held a steady 60 fps with no jank reported by Android’s profiler.

Durability was checked with an overnight run. The board streamed continuously for eight hours while a logic analyzer captured the USB frames off the wire. Over that window the sample counter missed 32 ticks, a drift of under 0.02 percent, and the display held 60 fps throughout. That run is the evidence that the pipeline can sustain a real clinical session rather than only a short demo.

Scope and next steps

The grid currently uses a fixed compile-time scaling rather than adapting to signal amplitude, evaluation leaned more on synthetic than live data, and power draw over long sessions was not yet profiled. Each of these is a clear next step rather than an open question: adaptive grid scaling, a broader live dataset, and a power characterization pass. The longer-term direction is on-device rhythm analysis, where the existing low-latency pipeline already provides the data path that such a model would consume.

← PROJELER
~/projects$ cat mobile-ecg-platform.md
HARDWARE
Sep 2024 – Jun 2025

Mobile 12-Lead ECG Platform

A solo, full-stack real-time electrocardiography system. A custom STM32 and ADS1292R analog front end streams cardiac signals over USB to a Flutter application that renders twelve leads on a calibrated medical grid at 60 fps, fully offline.

#STM32F103#ADS1292R#C / C++ firmware#TinyUSB#Flutter#Dart#USB serial

A handheld electrocardiography platform that captures real cardiac signals through a custom analog front end and renders up to twelve leads on a calibrated medical grid, in real time, entirely on a consumer phone with no network connection. The system spans the whole stack: an instrumentation-grade analog acquisition board, firmware on an STM32 microcontroller, a USB transport layer, and a Flutter application that performs signal conditioning and high-frequency custom rendering. It was built solo over nine months as a graduation project at Sabancı University.

The ECG acquisition board with annotated callouts for the STM32, ADS1292R, FT232, LCD, and BNC inputs
The custom acquisition board. STM32F103 drives the ADS1292R analog front end over SPI; the FT232 bridge exposes a second USB port for verification; BNC connectors carry the electrode inputs.
  • Up to 500 samples per second per channel, streamed over USB
  • Twelve lead lanes drawn at a steady 60 fps
  • Under 40 ms from acquisition to on-screen pixel
  • Under 100 USD bill of materials for the acquisition hardware
  • Runs fully offline, with no cloud, no account, and no network dependency

The problem

A twelve-lead electrocardiogram is the clinical reference for cardiac assessment because each lead observes the heart’s electrical activity from a different angle. That spatial coverage is what allows ischemia to be localized and what distinguishes one arrhythmia or conduction abnormality from another. A single lead is sufficient to screen a heart rhythm, but it cannot carry that spatial information.

The accessible end of the market reflects this gap. Consumer wearables and low-cost devices almost always expose one or two leads, while genuine multi-lead capability stays inside bulky and expensive clinical equipment. Many software-based solutions also transmit raw signal to a remote server for rendering or analysis. That round trip introduces latency and creates a privacy surface for data that is inherently sensitive.

This project targets the space in between: a way to view many leads at once, in real time, on a device a person already carries, with the signal never leaving the phone, at a hardware cost suited to community screening and education. The goal is accessible visualization and a reproducible performance baseline for mobile multi-lead display, not a regulatory-cleared diagnostic instrument. Framing the scope this way keeps the contribution precise. The platform demonstrates that the full acquisition and rendering pipeline can run on commodity hardware at clinical frame rates, which is the foundation that any later diagnostic capability would be built on.

System overview

The pipeline has four stages, each owned end to end:

  1. Acquisition. A custom analog board digitizes biopotentials from chest and limb electrodes.
  2. Transport. The microcontroller frames samples and streams them over native USB.
  3. Conditioning. The application filters and buffers the incoming stream in real time.
  4. Rendering. A custom paint loop draws the calibrated grid and waveforms at 60 fps.
Signal chain diagram showing acquisition, transport, conditioning, and rendering stages, plus the synthetic source and verification branch
The full signal chain: from electrode through the analog front end, USB transport, and Flutter conditioning pipeline to the rendered twelve-lead display. The synthetic source and dual-port verification branch are shown separately.

Hardware: the analog front end

The acquisition board is the component that separates this project from a charting application. At its center is the ADS1292R, a 24-bit, two-channel, simultaneous-sampling biopotential analog front end with an integrated right-leg drive amplifier and lead-off detection. Reading a clean electrocardiogram is difficult because the signal of interest sits at the level of microvolts and is buried under mains interference and motion artifact that can be orders of magnitude larger.

The right-leg drive is what makes the recovered trace clean. It continuously senses the common-mode voltage present on the body, inverts it, and feeds it back through the reference electrode, actively cancelling the interference that both inputs share. The result is a high common-mode rejection ratio and a stable baseline, which is visible directly in the recorded P, QRS, and T morphology.

The board exposes five electrode inputs through standard BNC connectors: right arm, left arm, left leg, the driven right-leg reference, and one precordial chest position. Standard clip electrodes connect to a volunteer. Because the front end provides two simultaneous acquisition channels, the recorded data covers the limb-derived leads, while the full twelve-lane view is completed from a separate synthetic source described below. Every connection is hand-soldered on perfboard, which makes the recovery of a clean microvolt-level signal a result in its own right.

Skin preparation has as much influence on the trace as the front end does. Contact points are wiped with isopropyl alcohol to remove skin oils and lower contact impedance, and a saline solution wets the electrode contacts so the signal couples cleanly through the reusable clip leads.

The live system during a development session: application source on the laptop, the board powered with its display active, limb clips and the alcohol and saline prep staged
The bench setup during a development session. The acquisition board is powered and connected to the laptop over USB; limb clips, isopropyl alcohol, and saline are staged for a live capture.
Live ECG capture showing leads I, II, and III on the calibrated grid
Live capture from a volunteer through the custom front end. Leads I, II, and III rendered on the calibrated medical grid at 25 mm/s and 10 mm/mV.

Firmware: STM32 acquisition

An STM32F103 drives the front end. The firmware acts as an SPI master to the ADS1292R, configures its registers for the target sample rate and gain, and reads conversion frames as they become available on the data-ready interrupt. Each frame is packed into a fixed-size record and pushed out over the microcontroller’s native full-speed USB interface using the TinyUSB stack.

Choosing the F103 specifically mattered here. Its on-chip USB peripheral allows the device to enumerate as a USB serial endpoint without an external bridge, which keeps the data path on the phone side short and the timing predictable. The firmware sets the ADS1292R into continuous mode at 500 samples per second, packs each conversion into a fixed-size record, and streams it without dropping frames across extended runs.

A self-instrumented verification path

The board carries a second, independent USB-to-serial bridge (an FT232) alongside the STM32’s native USB. This exposes two ports at once: the phone listens on the native USB endpoint while a desktop analyzer or logic analyzer reads the same stream on the second port. This dual output was used during timing tests, and for the long-duration run a logic analyzer captured the USB frames directly off the wire. Designing observability into the instrument itself, rather than trusting the phone’s view of the data, is a deliberate engineering choice and one of the more useful decisions in the project.

Diagram of the dual-capture verification path: the board emitting to both the phone's USB endpoint and the FT232 serial bridge simultaneously
The dual-capture verification path. Both the native STM32 USB port and the FT232 bridge are active simultaneously, letting a desktop analyzer read the same stream the phone receives.

Two signal sources by design

Development used two distinct signal sources rather than one. A standalone Arduino Nano runs a synthetic generator that replays prerecorded twelve-lead arrays over serial at a fixed rate. This produces a deterministic, repeatable input that isolates the application and rendering pipeline from the variability of live acquisition, which is what makes it possible to profile rendering performance honestly and to demonstrate all twelve lanes at once.

The standalone Arduino Nano synthetic ECG generator board
The standalone synthetic generator. An Arduino Nano replays prerecorded twelve-lead arrays over serial at a fixed rate, producing a deterministic input for isolating and profiling the rendering pipeline.
All twelve ECG lead lanes rendered simultaneously on the calibrated grid from the synthetic source
The full twelve-lead view rendered from the synthetic source. All lanes are shown simultaneously on the calibrated grid, confirming the rendering pipeline before connecting real electrodes.

The STM32 front end provides the second source: real biopotentials from a person. Separating a controlled test harness from the live instrument is the kind of discipline that keeps a result trustworthy, because each part of the system can be exercised independently.

Transport: from Wi-Fi to USB

The original design streamed samples wirelessly. In practice the wireless link proved unreliable under sustained load, with intermittent drops that corrupted a real-time trace in ways that were hard to recover from. The transport was rebuilt around a wired USB serial connection. This single decision moved link reliability from roughly four in five sessions to near certainty, removed an entire class of synchronization failures, and simplified the timing model on both ends. Trading a more impressive-sounding wireless feature for a connection that simply works was the correct call, and it shaped the rest of the system’s reliability budget.

Raw USB serial stream from the acquisition board plotted on a desktop analyzer, showing the low-level signal during bring-up and debugging
The raw serial stream on a desktop plotter during firmware bring-up. This low-level view was used to verify frame timing and data integrity before the Flutter application was connected.

Signal conditioning

Incoming samples are conditioned on the phone before they reach the screen. A moving-average stage smooths sample-to-sample noise, and an IIR band-pass filter removes baseline wander at the low end and high-frequency noise at the top, leaving the diagnostic morphology intact. The filter chain is implemented directly in Dart and runs in under three milliseconds per batch, which keeps it well within the per-frame budget and avoids any native dependency. Running the full conditioning path inside the application also means the signal is never handed to an external service to be cleaned.

Rendering: a calibrated grid at 60 fps

The display is drawn with a custom paint loop rather than a charting library, which is what makes both the calibration and the frame rate achievable. The grid follows standard electrocardiogram paper: a 25 mm per second sweep and a 10 mm per millivolt gain, with millimeters mapped to device pixels using the screen’s physical density so the grid is correctly scaled on real hardware.

The central performance technique is in how the scrolling trace is drawn. Redrawing every lane’s full history on each frame would mean repainting tens of thousands of points sixty times a second. Instead, the existing canvas content is translated by the per-frame sample advance, the newly exposed strip is clipped, and only the new segment of waveform is drawn into it. This turns a full redraw into an incremental one and roughly halves the per-frame cost, which is what holds the frame rate steady across all twelve lanes.

Each lead is backed by a ring buffer capped at ten thousand samples, and samples arrive in batches of around fifty per frame, which bounds memory and smooths the update cadence. A pinch gesture zooms the time axis, a swipe scrolls back through history, and a control returns the view to the live tail. The same Flutter and Skia codebase renders identically across platforms.

The Flutter application showing the device connection screen and the live ECG visualization with twelve lead lanes
The Flutter application. Left: device connection and live sample counters. Right: the twelve-lead visualization screen with the calibrated grid and scrolling waveforms.

Validation and performance

The system was exercised both with the synthetic generator and with live acquisition. Through the custom front end, a volunteer produced clean P, QRS, and T complexes on the limb-derived leads under mild motion, confirming that the analog chain and the right-leg drive perform as intended on a real signal.

On the performance side, end-to-end latency from acquisition to displayed pixel stayed under 40 ms during the volunteer test, with clean P, QRS, and T morphology on every active channel. The signal-conditioning chain ran in under 3 ms per batch on a Snapdragon 845, measured from the timing log, and rendering held a steady 60 fps with no jank reported by Android’s profiler.

Durability was checked with an overnight run. The board streamed continuously for eight hours while a logic analyzer captured the USB frames off the wire. Over that window the sample counter missed 32 ticks, a drift of under 0.02 percent, and the display held 60 fps throughout. That run is the evidence that the pipeline can sustain a real clinical session rather than only a short demo.

Scope and next steps

The grid currently uses a fixed compile-time scaling rather than adapting to signal amplitude, evaluation leaned more on synthetic than live data, and power draw over long sessions was not yet profiled. Each of these is a clear next step rather than an open question: adaptive grid scaling, a broader live dataset, and a power characterization pass. The longer-term direction is on-device rhythm analysis, where the existing low-latency pipeline already provides the data path that such a model would consume.