Trend Followers: Grading the Forecasters with a Turkish Finance BERT
A Turkish financial sentiment classifier for Borsa Istanbul, used not just to read sentiment but to backtest which brokerages and news sources are actually any good at calling the next day's market direction.
Trend Followers is a Turkish financial sentiment classifier for the Borsa Istanbul index (BIST-100), built as a project for an introductory data science course (Fall 2022, a four-person team). What sets it apart from a standard sentiment model is the question it was built to answer. The classifier is only the engine. The actual goal was to use it to grade the forecasters: to measure which brokerages and news sources are genuinely any good at predicting the next day’s market direction, by treating each source’s sentiment as a trading signal and scoring it over time.
The framing came from a concrete motivation, captured in the project’s goal of building an open-source alternative to a paid sentiment-analysis service for BIST-100. Rather than stop at “here is the sentiment,” the project asks the more useful and more interesting question: whose sentiment is worth listening to?
The pipeline
Getting there meant building the whole chain end to end. The first stage was data gathering, which was its own substantial effort: scraping daily strategy reports from four major brokerages, each behind a different site structure requiring its own approach, from Selenium walking a calendar widget to simpler request-and-parse scrapers, alongside financial news headlines and a batch of market-related tweets. The reports span 2021 to 2023.
Turning PDFs into usable text was deliberately surgical. Each broker’s report follows its own template, so per-broker extractors slice out the market-commentary section between known header markers specific to that broker’s format. It is brittle by nature, a template change would break it, but it is the honest way to extract clean signal from inconsistent documents.
Labeling combined two signals. First, each piece of text was tagged positive or negative based on the actual BIST-100 close-to-close move on the corresponding day, with a date-mapping layer that rolls weekend and holiday news forward to the next trading day. Then a Turkish keyword pass, built on a hand-assembled list of directional terms and a Turkish morphology library, with later-appearing keywords weighted slightly higher, was used to cross-check those labels. Reassuringly, the two approaches largely agreed.
The model
The classifier fine-tunes a Turkish BERT model (dbmdz/bert-base-turkish-cased) on the labeled corpus, reaching around 90% validation accuracy with an F1 near 0.91. One honest note on what that number means: because the labels are derived from next-day index moves, the model is partly learning the relationship between financial language and the market’s actual direction, which is exactly the signal the next stage needs, but it is not the same as accuracy against hand-verified human labels.
Grading the forecasters
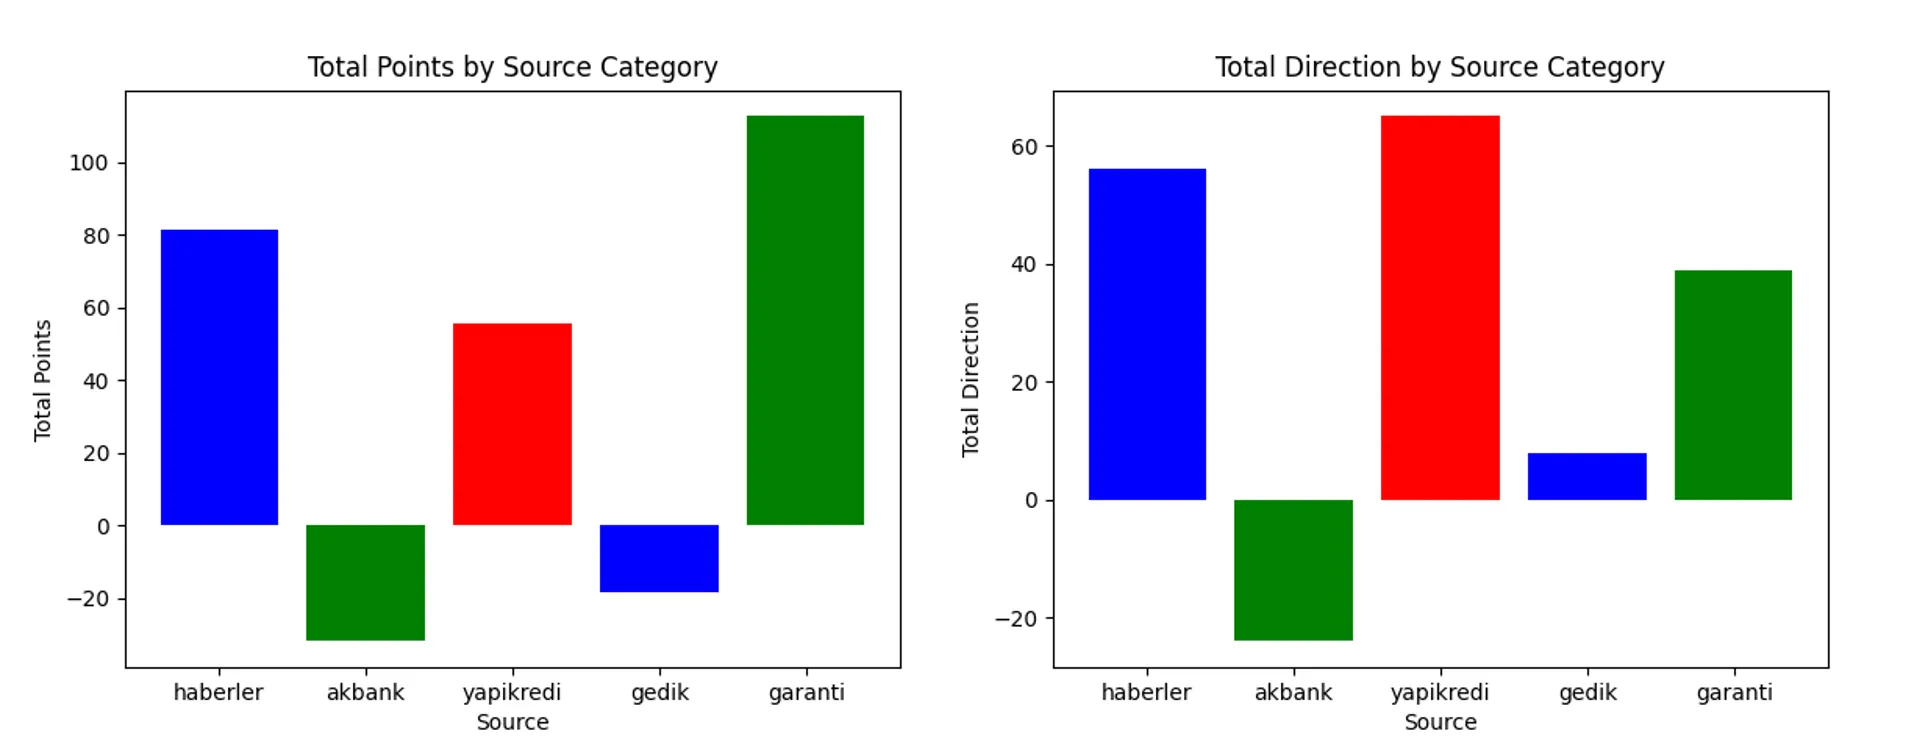
This is where the project earns its name. With a working sentiment model, each source can be treated as a trading signal and backtested. For every day a source published, the model reads its sentiment, that becomes a directional call, and the call is scored against what the market actually did. Two scores accumulate over time: a direction score (+1 for a correct up-or-down call, -1 for a wrong one) and a points score (the signed percentage move, credited when the direction was right and debited when it was wrong).
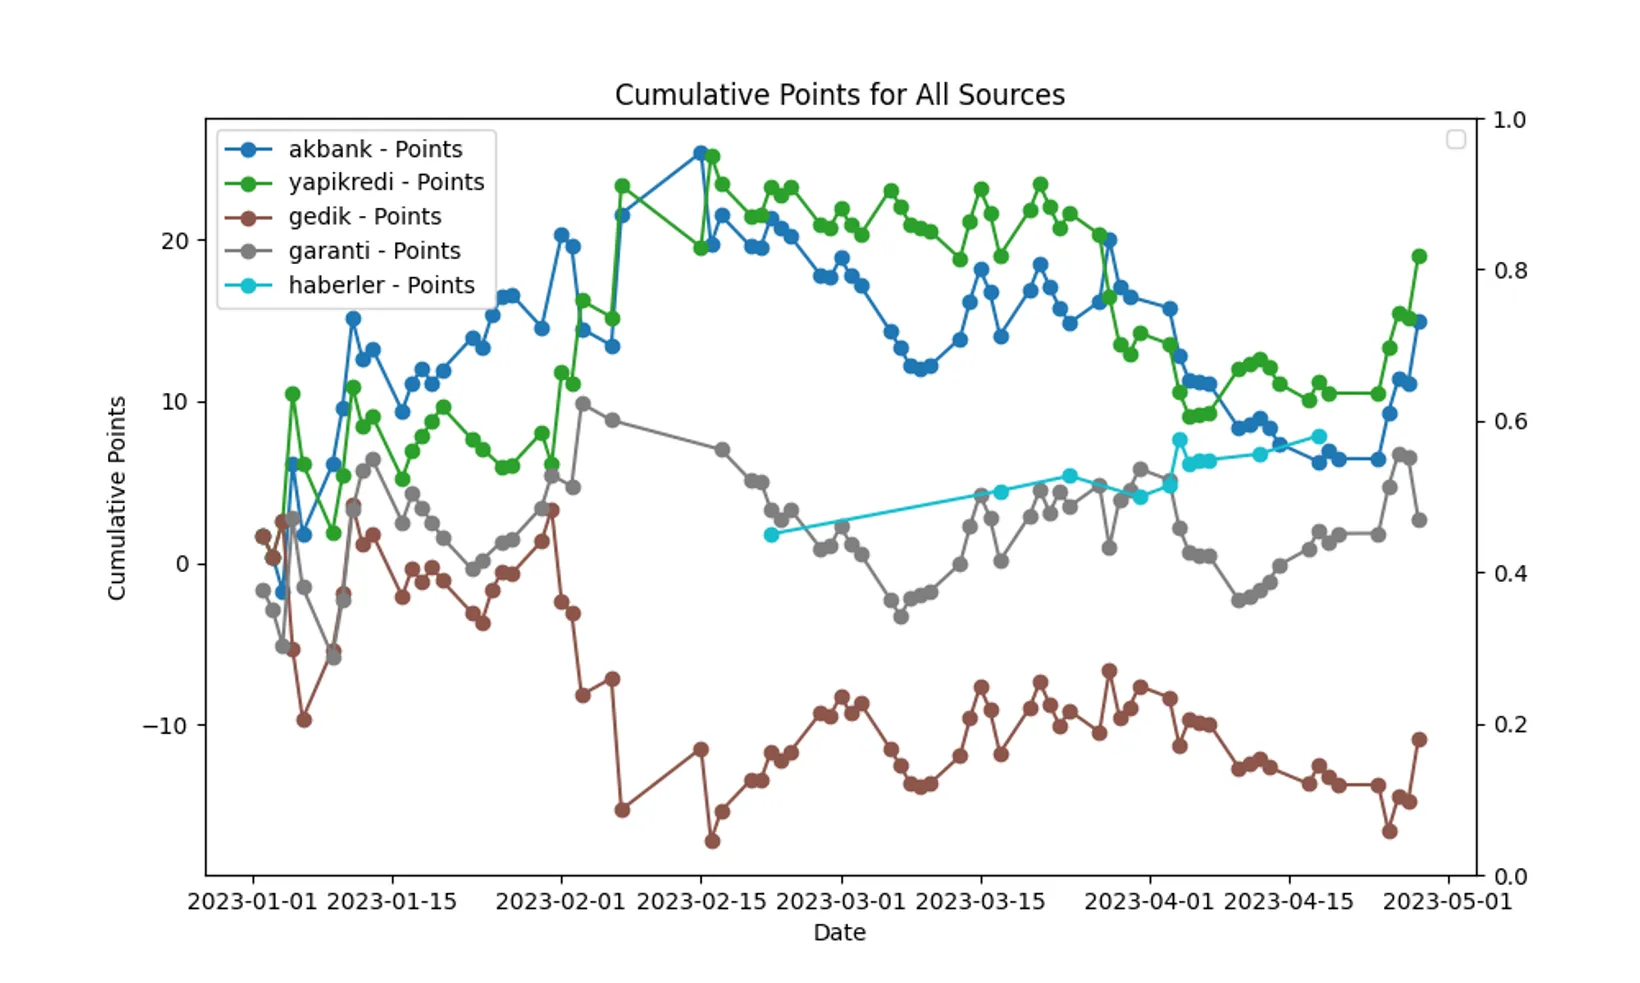
Plotted cumulatively, each source becomes a line, an equity curve for its predictive track record. Some sources spend the window in positive territory, others drift negative, and the final tallies separate them.
What the result does and doesn’t say
The construction is the interesting part, and it works: a sentiment model turned into a systematic, quantitative scorecard for forecasters, end to end from raw PDFs to cumulative equity curves. That idea is the contribution, and it is a genuinely good one.
What the numbers establish is narrower, and worth stating plainly rather than overselling. The cumulative curves are revealing in a way that cuts against a simple ranking: the strongest sources climb through the first weeks and then hand much of it back by spring, which is precisely the shape you would expect if next-day direction is mostly noise and early leads are partly luck. The per-source windows also differ in length, so the totals are not all measured over identical periods. None of this undercuts the method; it is the method working honestly and reporting an uncomfortable truth. Predicting tomorrow’s market from today’s sentiment is genuinely hard, and a scorer built carefully enough will show you that rather than hide it.
That, in the end, is the most valuable thing the project demonstrates. It is straightforward to build a model that scores 90% on a benchmark. It is more interesting, and more honest, to then turn that model on the real world and let it tell you how much the prediction is actually worth.